Tableau, PowerBI, and other data visualizations are great at what they do, but it can be painful to do something non-standard. You can often find hacks to get to your desired result….. but sometimes it’s just not possible.
Most analysts and data scientists are skilled in SQL and either Python or R. But we’re not often familiar with Javascript and the various related tools. That’s unfortunate since Javascript can be used to build powerful, interactive visualizations that expand beyond what Tableau and Power BI offer.
For example, I wanted a visualization to explore data in multiple dimensions. I quickly built this view using Three.JS despite having limited Javascript experience:
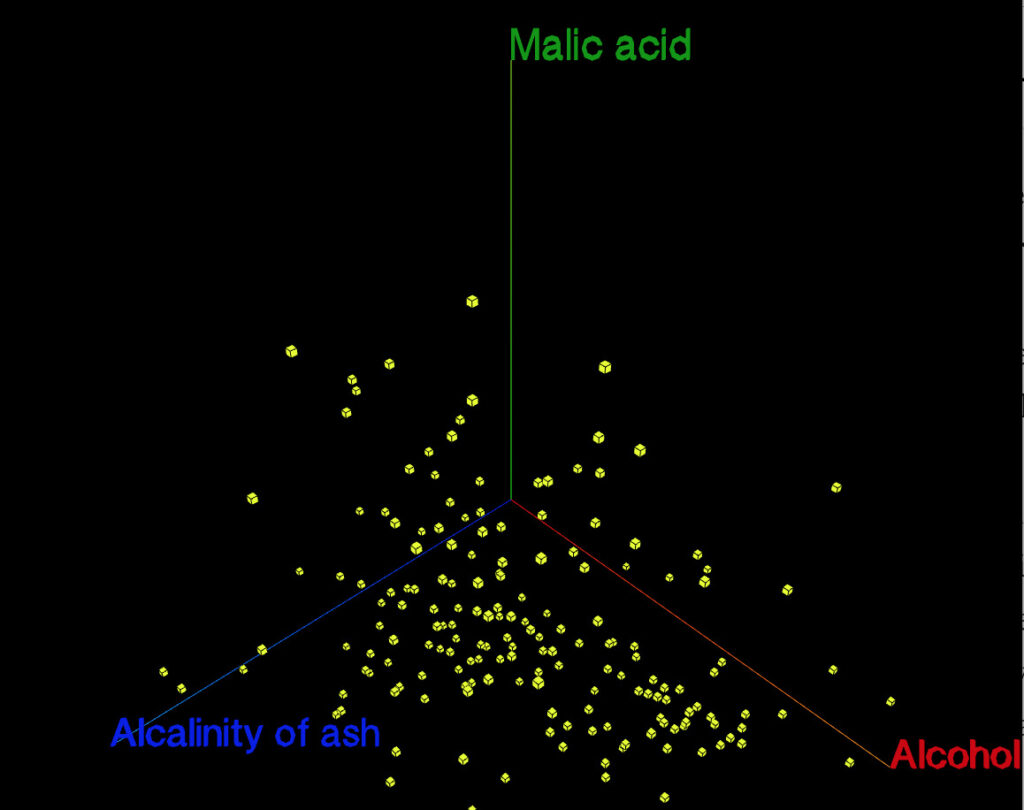
Although this public view uses a data set based on wine characteristics, there are a couple cool features that I’d like to highlight:
- You can click and drag to move the view around.
- You can mouse over a datapoint and t information about it will appear in the sidebar
- Hit ‘w’ to see the view pivot automatically as you select different options.
- Three.JS plays nicely with VR, so this will be useful for exploring data in VR.
This sort of visualization isn’t relevant in many situations, but it was helpful when I wanted to quickly explore a dataset with high dimensionality.
A couple notes about Javascript:
- Javascript struggles with data wrangling (even though dataframe.js is useful in some contexts). I found it more efficient to use Python to do a lot of the initial data work and have Javascript simply ingest the cleaned data.
- Javascript also plays nicely with JSON and other data analysis data formats.
- Although I used Three.js for this tool, it’s useful to know about other options like D3.js, NVD3, etc.
- Github Pages also makes it really easy to host projects.
- You can embed webpages within Tableau and thus your Javascript visualization would seem like an integrated part of your Tableau dashboard.
But just because you can use Javascript to roll your own data visualization, doesn’t mean it’s always a good investment of your time.